Grades
6 - 8
Lesson Plan: Constructing Graphs, Tables, and Equations Relating Independent and Dependent Variables
In this lesson, students will represent the relationship between independent and dependent variables in through a rock-climbing storyline.
Objectives
Students will:
Materials
Set Up
Lesson Directions
Introduction to New Material
Step 1: Tell students that they will be calculating the costs of a college rock-climbing team traveling to a national rock-climbing competition. Have students brainstorm what equipment might be required for such a team (climbing shoes, helmets, harnesses, chalk, chalk bags, carabiners, belay devices, ropes, and so on). They will be relating the costs of climbing to the number of athletes involved in the competition.
Step 2: Recall the definitions for independent variable and dependent variable:
Ask students:
Have students explain their thoughts about why the number of athletes is the independent variable and the cost is the dependent variable.
Step 3: Display an empty table to have students relate the number of athletes in the rock-climbing competition to the cost of climbing shoes:

Then have students write the independent variable as the header for the left-hand column and the dependent variable as the header for the right-hand column:

Then begin to have students fill in the table to see the costs grow as the number of athletes increases. Start with 1 athlete. Tell students that each pair of shoes costs $89. As students fill in the rest of the table, ask them how they are determining the cost of the climbing shoes for each row or each number of athletes.
Step 4: Have students analyze the table after 5 or 6 rows have been filled in. Ask:
Step 5: Have students participate in helping you graph the relationship between the number of athletes and the cost of climbing shoes:

Ask students what they notice about the graph.
Sample Responses: It is linear. If the line were to be extended to 0 athletes, it would go through the origin. The slope is 89.
Step 6: Split the class into 6 groups that will each represent a different type of climbing equipment with a table, a graph, and an equation. Use the following equipment and prices: helmets ($62), harnesses ($56), chalk ($12 for a chalk bag; $11 for a canister of chalk), carabiners ($39 for a 6-pack), ropes ($260), and belay devices ($29). Have students consider the independent and dependent variables involved with this equipment, and have them prepare tables, equations, and graphs to present to the rest of the class.
Note: Some equipment, such as the ropes, can be used by more than one teammate. Have the group working on the ropes consider this as they represent the problem situation. Perhaps they’ll consider buying two ropes per group of 6 climbers, for example.
Step 7: Have each group present their findings to the class. During these presentations, discuss which equipment might have a one-to-one correspondence for equipment-to-climber, and which equipment might be shared among the team.
Guided Practice
Step 8: Have students work in pairs to put together a table, graph, and equation for the total price of rock-climbing equipment for a team of up to 12 rock climbers. Have them consider which equipment might be shared among climbers and which equipment requires a one-to-one correspondence when putting together these tables, graphs, and equations. (For more advanced groups, consider providing a budget, which would make those “shared equipment” calculations even more important.)
Step 9: Encourage students to use tables first to represent the problem situation, then move from the tables to graphs, then to equations. If students struggle with representing shared equipment, allow them to assume that each climber needs one of each type of equipment. As students become more familiar with the process, encourage them to explore assigning shared equipment to the climbers.
Step 10: As a final challenge, tell students that the climbers will need to travel from Manassas, Virginia, to Kennesaw, Georgia, in order to compete. The team will charter a bus to drive to and from the competition. The team will need to rent a bus for 6 days at $900 a day. Have students incorporate this expense in order to form a new table, graph, and equation. Have them keep in mind that this one bus will carry all climbers; there need not be a bus for each climber.
Step 11: Checking for Understanding: Review students’ answers and graphs as a class and respond to any questions.
Independent Practice
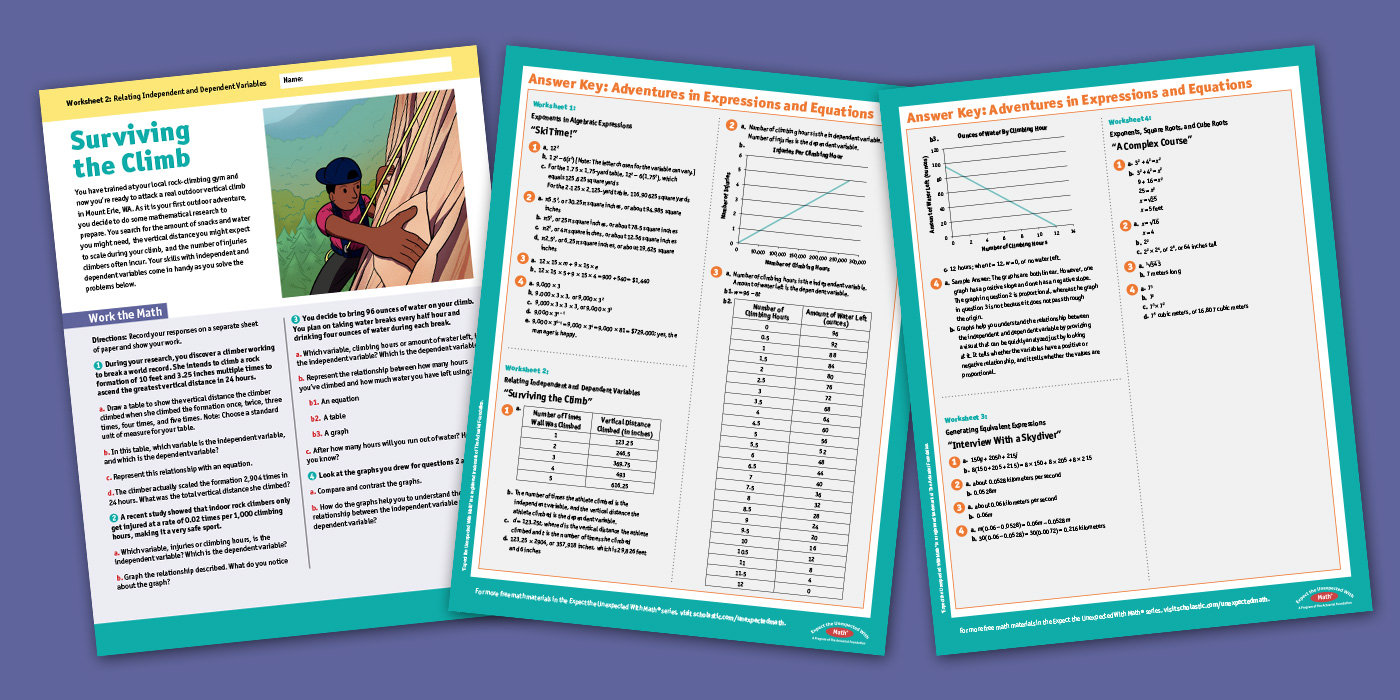
Step 12: Assign the Surviving the Climb: Relating Independent and Dependent Variables Worksheet printable for classwork or homework.
Step 13: Checking for Understanding: Review the answers to the Surviving the Climb: Relating Independent and Dependent Variables Worksheet, which are provided on page 1 of the Answer Key: Adventures in Expressions and Equations printable. Make sure students explain their mathematical thinking. Address any misconceptions that may arise.
Standards


